A high bay fixture should deliver steady, dependable light across warehouses, workshops, gyms, and production floors. When it pulses above a work aisle, the problem can involve more than a failing LED chip. Many facility managers ask, “why is my led high bay fixture flickering,” after noticing brief flashes, visible pulsing, or camera bands under the lights.
The U.S. Department of Energy explains that an LED system depends on its driver, controls, thermal design, and power quality. The LED package is only one part of the system. IEEE Standard 1789-2015 also identifies flicker as a waveform issue that can create visual discomfort under certain conditions. NEMA LSD 63-2012 provides measurement guidance for temporal light artifacts. These references show why a simple visual check may not reveal the complete fault.
Look closely at the installation. A loose line connection may flicker when equipment starts nearby. A worn driver can pulse after warming for twenty minutes. Dimming controls, incompatible sensors, voltage fluctuation, and poor grounding can create similar symptoms. The fixture may appear normal from the floor, yet a phone camera can reveal dark rolling bands.
Do not replace every fixture immediately. That approach wastes time and may hide the real cause. Record when the flicker begins, whether all fixtures behave similarly, and whether heavy machinery operates nearby. Then inspect the driver, wiring, controls, and supply voltage with qualified personnel. Good troubleshooting is evidence-based, cautious, and repeatable. Sometimes, the first assumption is wrong.
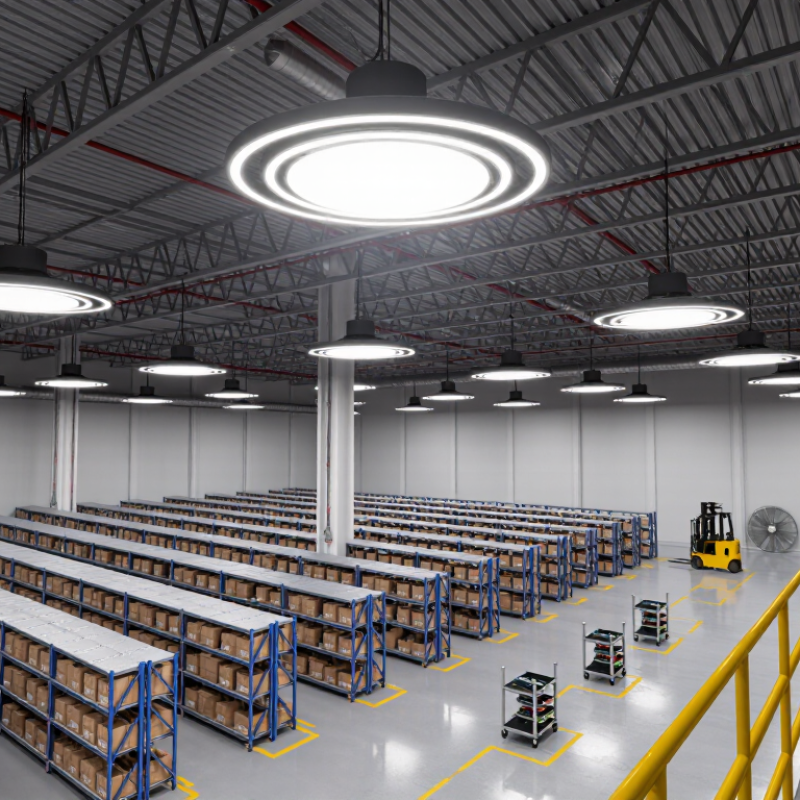
Why Is My LED High Bay Fixture Flickering?
Measure Flicker with IEEE 1789: Percent Flicker and Flicker Index
An LED high bay can appear steady while its light output rises and falls rapidly. This may come from a failing driver, loose connection, incompatible dimmer, or unstable control signal. IEEE 1789 provides a practical framework for evaluating this modulation. It does not simply ask whether flicker is visible. It connects modulation depth and frequency with potential biological risk.
Percent flicker uses the waveform’s maximum and minimum values: (maximum − minimum) ÷ (maximum + minimum) × 100. A higher result means stronger output variation. Flicker index measures the area above the average light level, divided by the total waveform area across one cycle. These values describe different patterns. Two fixtures can share the same percent flicker but have different flicker indexes. That detail is easy to miss. Use a calibrated photodiode and oscilloscope when possible. A phone camera is only a screening tool, not reliable evidence.
Tips: Measure at full output and every dimming level. Record frequency, percent flicker, flicker index, and waveform shape. Check the fixture after warm-up, because heat can change driver behavior. Compare readings with IEEE 1789 recommendations, while remembering that measurement conditions affect results. If the waveform looks irregular, inspect wiring and controls with a qualified electrician. A replacement may help, but diagnosis should come first. Honestly, one measurement is rarely enough. Temperature, supply variation, and sensor placement can distort the result.
This reference waveform represents a 120 Hz light-output ripple with a maximum of 100%, a minimum of 80%, and an average level of 90%. Percent flicker is calculated as (maximum − minimum) ÷ (maximum + minimum) × 100. Flicker Index is the area above the average light level divided by the total area under the waveform. IEEE 1789 evaluation should also consider modulation frequency, exposure conditions, and the applicable recommended limits.
Why Is My LED High Bay Fixture Flickering?
Check Input Power Using IEC 61000-4-30 Voltage-Quality Methods
Flicker often begins at the input terminals, not inside the LED driver. Start at the terminals. Use a calibrated power-quality analyzer and follow IEC 61000-4-30 methods. Measure RMS voltage, frequency, voltage dips, swells, interruptions, unbalance, harmonics, and rapid voltage changes. For 60 Hz systems, the method evaluates voltage across 12-cycle windows, then aggregates results into defined intervals. Record several hours, not only one minute.
EPRI’s widely cited assessment estimated that power disturbances cost the U.S. economy between 119 and 188 billion dollars annually. That figure explains why a brief voltage event deserves attention. Compare the captured waveform with the fixture’s rated input range. A dip during motor starting may trigger visible flicker. Neutral movement, loose terminals, or excessive harmonic current can produce similar symptoms. Check the neutral conductor carefully.
I have seen technicians replace drivers too early. I have made that mistake. A single capture can mislead. Repeat the test while nearby compressors, welders, or lifts operate. Review voltage unbalance and total harmonic distortion, then separate supply problems from driver problems. IEC 61000-4-30 improves repeatability, but it cannot identify every installation defect. Record the instrument class, location, time, and operating load with each result. That evidence makes the next repair less speculative.
| Voltage-Quality Dimension | IEC 61000-4-30 Measurement Method | Key Data to Record | Flicker Relevance for LED High Bays | Practical Check | Result Classification |
|---|---|---|---|---|---|
| Supply Voltage Magnitude | Measure the RMS voltage using the standard voltage-magnitude measurement process. For Class A measurements, the basic measurement window is 10 cycles on a 50 Hz system or 12 cycles on a 60 Hz system. | Nominal voltage, minimum voltage, maximum voltage, RMS variation, and phase-to-neutral or phase-to-phase voltage. | Voltage that is consistently too low, too high, or rapidly changing can cause the LED driver to enter protection, current-limiting, or restart conditions. | Compare the measured RMS value with the fixture nameplate input range and the electrical design voltage. Check the reading at the fixture terminals while the lights are operating. | Within equipment range; outside equipment range; or unstable under load. |
| Voltage Dips | Record the retained voltage and duration of each event. A dip is a temporary reduction in RMS voltage below a specified threshold relative to the declared or nominal voltage. | Event start time, minimum retained voltage, duration, affected phase, and number of events. | A short dip can interrupt the internal DC bus or control circuit, producing a visible flash, dropout, or repeated restart. | Check whether flicker occurs at the same time as motor starts, welding activity, compressor operation, or large switching loads. | No coincident event; coincident dip; repeated dip pattern. |
| Voltage Swells | Record the increased RMS voltage and event duration using the supply-voltage-event method. | Maximum RMS voltage, duration, affected phase, and event frequency. | Swells may trigger driver overvoltage protection or increase the stress on input capacitors and switching components. | Inspect the supply during switching of capacitive banks, unloaded transformers, or large inductive loads. | No event; occasional swell; recurring swell. |
| Short Interruptions | Record events in which the supply voltage falls to a very low value or disappears for a short period, including event duration and phase information. | Interruption duration, residual voltage, phase affected, and number of occurrences. | Even a brief interruption can reset an LED driver and may appear as a single flash or synchronized dark interval across multiple fixtures. | Compare fixture behavior with other loads on the same circuit and inspect upstream breakers, disconnects, terminals, and control contacts. | Local interruption; circuit-wide interruption; upstream interruption. |
| Rapid Voltage Changes | Measure successive voltage changes and their magnitude over time. IEC voltage-quality methods distinguish rapid changes from slower long-term voltage variation. | Voltage-change magnitude, number of changes per minute, sequence, and time correlation with switching loads. | Repeated step changes can produce visible modulation even when the average voltage appears acceptable. | Use a power-quality recorder with event capture and monitor the circuit during switching of contactors, relays, dimmers, and large loads. | Stable; occasional step change; repetitive step change. |
| Flicker Severity | Evaluate short-term flicker severity, Pst, using the applicable flicker measurement method. Long-term flicker severity, Plt, is calculated from successive Pst values. | Pst, Plt, measurement interval, observation period, and time of highest severity. | Flicker indices help identify visible light modulation caused by repeated voltage fluctuations rather than a simple steady undervoltage condition. | Measure at the same point where the LED fixture is connected. Compare the time pattern with observed flicker and nearby load activity. | Low; intermittent; persistent; or load-correlated flicker. |
| Voltage Unbalance | Determine the ratio of negative-sequence voltage to positive-sequence voltage for three-phase systems. | Positive-sequence voltage, negative-sequence voltage, percentage unbalance, and phase-by-phase RMS voltage. | Unbalance can cause unequal operating conditions between fixtures connected to different phases and may increase stress in three-phase equipment. | Measure all phase voltages at the panel and at the fixture connection point. Look for loose neutral conductors or uneven phase loading. | Balanced; phase-dependent issue; wiring or loading concern. |
| Harmonic Voltage Distortion | Measure individual harmonic components and total harmonic distortion. The commonly used voltage THD expression is: THD = √(V₂² + V₃² + … + Vₙ²) ÷ V₁ × 100%. | Individual harmonic percentages, voltage THD, measurement location, and frequency spectrum. | Distorted voltage can affect LED-driver input stages, increase heating, and interact with other nonlinear loads on the same distribution system. | Check the spectrum at the panel and fixture input. Investigate whether distortion increases when other electronic loads are energized. | Low distortion; elevated distortion; distortion correlated with load operation. |
| Power Frequency | Measure the fundamental supply frequency over the required observation period and record deviations from the nominal frequency. | Nominal frequency, minimum frequency, maximum frequency, and time variation. | Frequency problems are less common than voltage disturbances but may indicate a generator, inverter, or isolated power-system issue. | Verify whether the circuit is supplied by a utility source, generator, UPS, or inverter. Compare frequency behavior during source transfer. | Stable frequency; source-transfer variation; abnormal frequency deviation. |
| Neutral and Ground Integrity | IEC 61000-4-30 provides voltage-quality measurement methods; conductor integrity must also be verified through safe electrical inspection and appropriate diagnostic measurements. | Neutral-to-ground voltage, phase-to-neutral voltage, terminal temperature, connection condition, and voltage drop under load. | A loose neutral or high-resistance connection can create changing voltage between fixtures and produce intermittent flicker, especially on multiwire circuits. | De-energize before tightening or inspecting connections. Use qualified personnel and follow applicable electrical safety procedures. | Normal connection; suspected high-resistance connection; urgent maintenance issue. |
| Measurement Location | Use a voltage-quality instrument suitable for the required IEC 61000-4-30 performance class and document the measurement point. | Service entrance, distribution panel, branch circuit, fixture terminals, cable length, phase, and neutral arrangement. | A disturbance may be visible at the fixture but not at the panel because of voltage drop, shared loads, or a poor local connection. | Measure first at the panel and then at the nearest affected fixture while the flicker is occurring. | Upstream issue; branch-circuit issue; local fixture or connection issue. |
A flickering high bay often points to the driver, not the LED chips. I once blamed loose wiring first. That shortcut was wrong. Disconnect power, then inspect the driver for swollen components, darkened terminals, or cracked insulation. With a suitable oscilloscope, measure the driver’s output ripple under load. Compare the waveform with the manufacturer’s limits. IEEE 1789-2015 evaluates flicker through both modulation depth and frequency, so a simple voltage reading cannot reveal every problem.
Heat matters. Measure the driver case temperature after two hours at full load. A hot warehouse ceiling can push components beyond their intended rating. The U.S. Department of Energy’s 2023 Solid-State Lighting R&D Opportunities report identifies thermal management and driver reliability as continuing barriers. DOE reliability guidance also treats 100,000 hours as a design reference, not a guaranteed service life. Aging capacitors may increase ripple slowly, causing visible pulsing before complete failure.
Check the input range carefully. A fixture rated for 120–277 volts may flicker when supply voltage falls outside that range, especially during generator operation or heavy industrial loads. Verify line voltage with a true-RMS meter. Then compare it with the driver label. ENERGY STAR commercial lighting criteria commonly use a power-factor threshold of 0.90, but power factor does not prove stable output. The test can still mislead. Humidity, poor grounding, and incompatible controls may contribute. Record temperature, input voltage, ripple, and flicker frequency before replacing parts.
A flickering LED high bay often points to the dimming circuit, not the LED board itself. Start by checking the control method. A 0–10 V input should receive a stable DC signal, commonly between zero and ten volts. Loose low-voltage wires can create visible pulsing when the driver searches for a valid level. Measure the signal at the fixture terminals, not only at the wall controller. If voltage jumps, inspect polarity, grounding, splices, and shared control wiring.
Tips: Turn power off before opening the fixture. Use a multimeter to watch the 0–10 V reading during flicker. If possible, test one fixture alone. This isolates network problems quickly. Keep control wires separate from noisy power conductors, where practical.
PWM controls can flicker when their frequency is too low or incompatible with the driver. Some drivers also interpret the signal incorrectly after a control-system update. Occupancy and daylight sensors may repeatedly change output near their detection threshold. Temporarily bypass the sensor and set the fixture to full output.
I once blamed a failing fixture first. That assumption delayed the repair. Check the controller settings and input specifications carefully. If flicker remains at full output, inspect line voltage, neutral connections, and driver stability. An oscilloscope can reveal ripple that a basic meter misses.
A flickering high bay fixture needs evidence, not guesswork. Start with the evidence. Record the fixture’s input voltage, operating temperature, and visible flicker pattern. A loose connection, aging driver, incompatible dimmer, or unstable control signal can create similar symptoms. In field service, technicians should photograph wiring conditions before replacing parts. This simple record prevents assumptions and supports repeatable repairs.
After the repair, compare measurements with the manufacturer’s specifications. Check input power, current, power factor, correlated color temperature, and lumen output. Use an LM-79 test report or an accredited laboratory measurement when possible. LM-79 testing provides a controlled method for evaluating electrical and photometric performance.
The fixture should reach its normal operating temperature before testing. Record the test voltage and environmental conditions. Small differences matter.
LM-79 data can confirm whether output and electrical performance are reasonable, but it does not replace dedicated flicker analysis. Use a suitable photometer or oscilloscope to examine modulation depth, frequency, and waveform behavior. Compare results before and after repair.
A brighter fixture is not necessarily a healthier fixture. I have seen repairs that reduced visible flicker while leaving unstable current behind. That result deserves another inspection. Check the driver, terminals, controls, and supply voltage again. Manufacturer limits should guide acceptance, not visual judgment alone.
Its output may rise and fall too quickly for your eyes. Possible causes include driver aging, loose wiring, unstable controls, or an unsuitable dimmer. The room may look normal. Measure the waveform instead of trusting visual inspection.
Use this formula: (maximum − minimum) ÷ (maximum + minimum) × 100. A higher percentage means stronger light variation. Record the waveform’s maximum and minimum values carefully. Small measurement errors can change the result.
Flicker index compares the area above average light output with the total waveform area. It describes the waveform’s shape, not only its depth. Two fixtures can share the same percent flicker but have different flicker indexes.
A calibrated photodiode and oscilloscope provide stronger evidence. A phone camera is useful only for screening. It cannot reliably prove flicker performance. Measure at full output and every dimming level.
IEEE 1789 considers both modulation depth and frequency. A small variation at one frequency may differ from a deeper variation at another. Compare measured values with the standard’s recommendations. One reading is rarely enough.
Voltage dips, swells, interruptions, unbalance, harmonics, and rapid changes can disturb the driver. Motor starting may create a brief voltage dip. Loose neutral connections can cause trouble too. Check the input terminals first.
Use a calibrated power-quality analyzer and suitable IEC 61000-4-30 methods. Record several hours, not one convenient minute. Test while compressors, lifts, or other heavy equipment operate. Note the instrument class, location, time, and load.
Measure the driver case temperature after two hours at full load. High ceiling temperatures can stress capacitors and other components. Aging may increase ripple slowly before complete failure. The light may pulse before the driver stops working.
Inspect for swollen components, dark terminals, cracked insulation, poor grounding, and loose connections. Verify true-RMS input voltage against the driver’s rated range. Record temperature, ripple, frequency, and waveform shape. I have replaced parts too early before. Diagnose first.
If you are asking, “why is my led high bay fixture flickering,” begin with a structured diagnosis rather than replacing parts immediately. Measure the light output using IEEE 1789 concepts, including percent flicker and flicker index, to determine whether the fluctuation is visually significant or potentially harmful to sensitive applications. Then check the incoming electrical supply with voltage-quality methods aligned with IEC 61000-4-30. Unstable voltage, loose connections, phase issues, or excessive disturbances can all contribute to flickering.
Next, inspect the LED driver for output ripple, signs of aging, overheating, and operation outside its rated input range. Dimming equipment should also be tested carefully, including 0–10 V signals, PWM controls, occupancy sensors, and other control devices that may send inconsistent commands. After repairs or adjustments, confirm stable performance with LM-79-style measurements and compare the results with the fixture manufacturer’s specifications. This process helps identify whether the cause is electrical, thermal, control-related, or internal to the driver.